Here is our guide for Tokyo.
BLOG
ブログ一覧
Greetings about starting of our business
TPFL started its business in 2016.
Japan is a country far from Europe but Japan has the third largest economy in the world.
Japan will host the next summer Olympics and the number of tourists from overseas has been increasing rapidly for several years.
We suppose there are many investors who dream about owning property in Tokyo, the capital city of Japan.
However the Japanese language is very difficult, isn’t it?
Japanese people are not good at speaking English.
Also Japan has many unique commercial customs in real estate business field.
Buying, owning and managing property in Tokyo from overseas in these circumstances is really difficult.
That is why you need a reliable business partner.
TPFL is always on your side as we leverage each other’s specialty for property law and financial planning.
Please get in touch for us.
We are aiming to release our movie about real estate, daily life, unique custom and the environment in Japan shortly. Please look out for it.
The working age population in Tokyo
In central Tokyo (Chiyoda ward, Chuo ward and Minato ward), it is very lively in terms of population distribution. The graph below shows that the age groups in the Central Tokyo area are divided into three: the Younger generation (0-14 years old), the Working-age population (15-64 years old) and the Aging population (over 65). A comparison of those groups, in the whole Japanese population, Tokyo district and several other cities are in the graph.
In the whole of Japan, the aging population (over 65) accounts for 27% and a quarter is senior citizens. On the other hand, the younger generation (0-14 years old) accounts for 12.6%, only one person in eight. This arises from the low birthrate and longevity in Japan. However in the three central wards, the proportion of its aging population is 10% lower than the national average. The younger generation doesn’t vary much from the national average but the proportion of working-age population is around 10% higher than the national average.
Because of the strong consumer confidence shown by the working generation and pupils, the number of supermarkets and convenience stores is increasing and it makes the town livelier.
From the information, when we look at other cities, in Urayasu city and Kayanowan city, the proportion of the younger generation is high, especially in Kayanowan city, where the younger generation is 1.5 times higher than the national average, and it is a so-called “Young city”. In Yubari city, Atami city, Hagi city, the proportion of their aging population is higher than the national average and four out of ten people are senior citizens.
When you see the population rate, you know the fascination of central Tokyo.
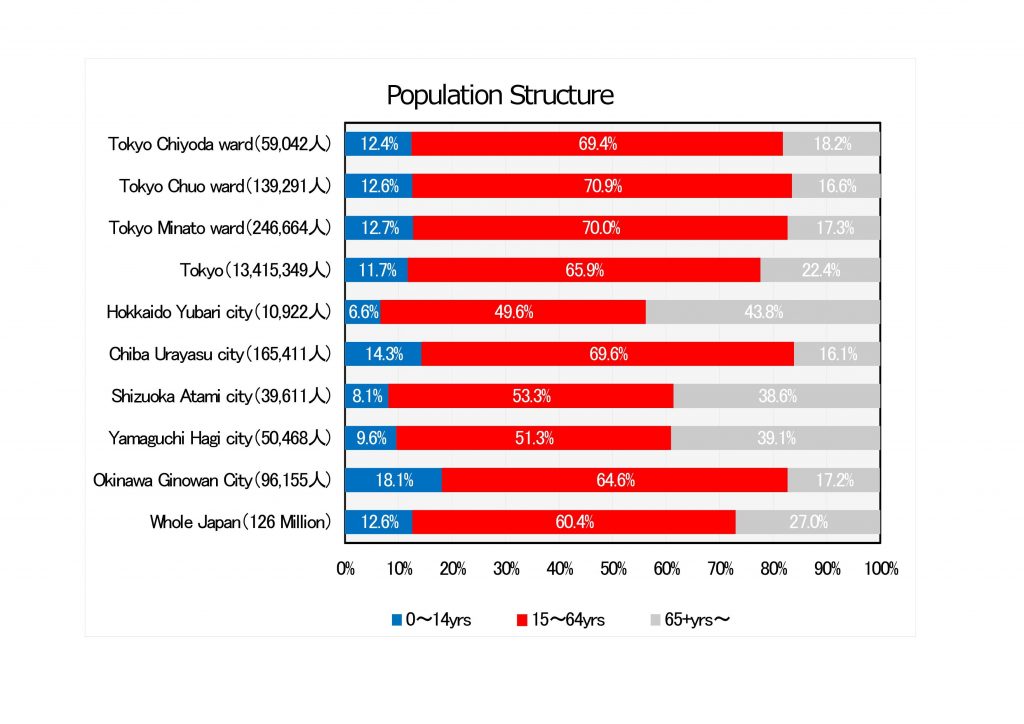 Reference: The data for the whole of Japan is according to population statistics in the Statistics Bureau. The data of Tokyo is according to the population census in the General Affairs bureau.
The data for Yubari city and Atami city are according to the population census in 2010. Other cities are according to their city council data and calculated by the author.
The reference date is on 1st March 2016 in Japan, 1st Jan 2016 in Tokyo, 31st March in Kayanowan city, 29th Feb 2016 in Hagi city, 1st Oct in Yubari city and Atami city and 1st Oct 2016 in other cities.
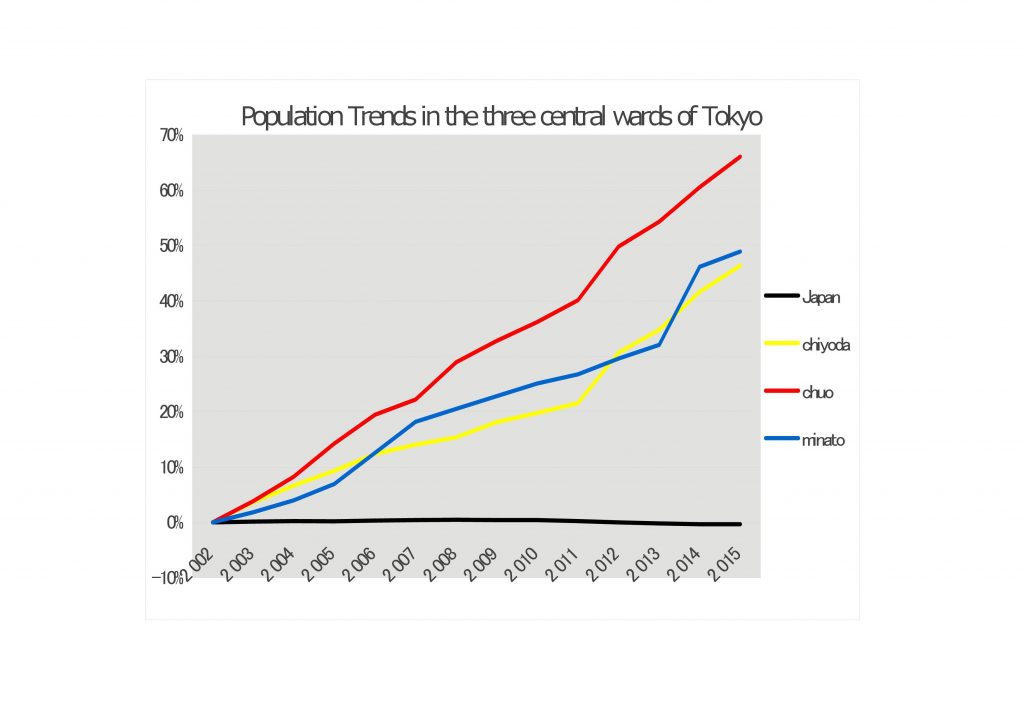
Tokyo growing population
In the centre of Tokyo, there is always a lively atmosphere because there are many offices and commercial facilities and a lot of people come to work and go shopping in the city.
In recent years, the number of residents has been rapidly increasing and it is becoming more active for day-to-day consumption. The graph below shows Population Trends in the three central wards of Tokyo (Chiyoda, Chuo and Minato). The graph is based on the rate of change of population from 2002 to 2015 (Each year is based on October 1st). The total population of Japan was 127,110,000 in 2015, in comparison to 127,480,000 in 2002, which is an 0.29% decrease (375,776 people).
However the three wards of central Tokyo (Chiyoda, Chuo and Minato) have quite different circumstances. In Chiyoda ward the population increased by 46%, (39,928→58,457), in Chuo ward by 66%, (85,360→141,750)and in Minato ward by 49% (163,777→243,904). The graph shows the significant increase over the last 13 years. The main factors are the large supply of apartments at a reasonable cost, combined with every convenience and a well-equipped urban infrastructure.
You can see the lively atmosphere in the centre of Tokyo by viewing this significant population transition. The number of people will be continuously increasing up to the Olympics and Paralympics in 2020 in Tokyo.