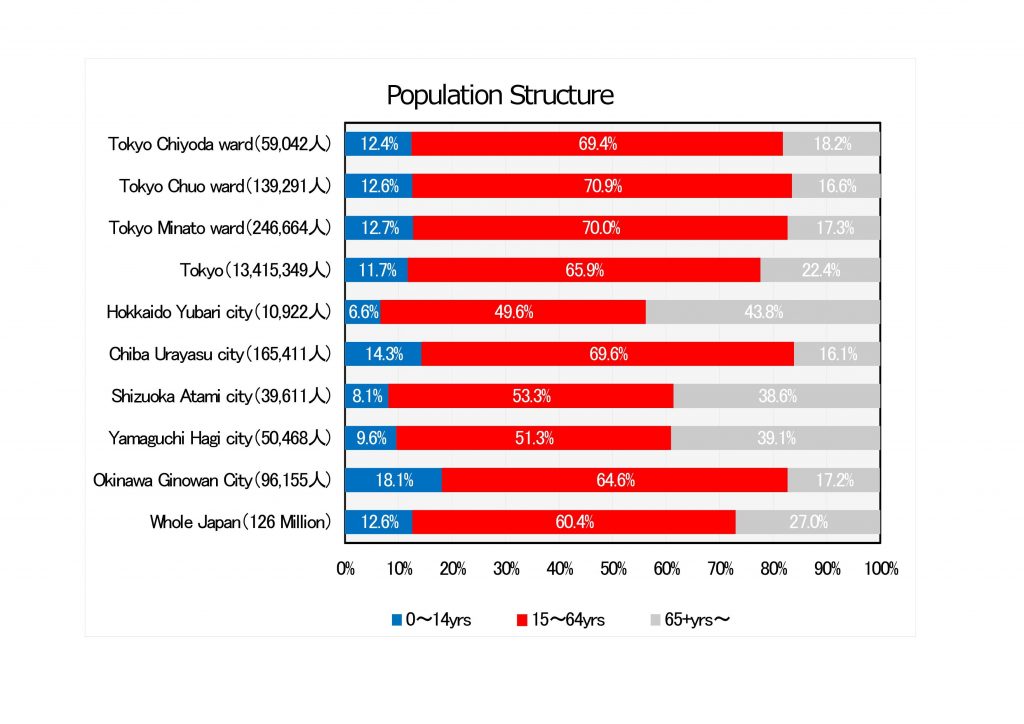
In central Tokyo (Chiyoda ward, Chuo ward and Minato ward), it is very lively in terms of population distribution. The graph below shows that the age groups in the Central Tokyo area are divided into three: the Younger generation (0-14 years old), the Working-age population (15-64 years old) and the Aging population (over 65). A comparison of those groups, in the whole Japanese population, Tokyo district and several other cities are in the graph.
In the whole of Japan, the aging population (over 65) accounts for 27% and a quarter is senior citizens. On the other hand, the younger generation (0-14 years old) accounts for 12.6%, only one person in eight. This arises from the low birthrate and longevity in Japan. However in the three central wards, the proportion of its aging population is 10% lower than the national average. The younger generation doesn’t vary much from the national average but the proportion of working-age population is around 10% higher than the national average.
Because of the strong consumer confidence shown by the working generation and pupils, the number of supermarkets and convenience stores is increasing and it makes the town livelier.
From the information, when we look at other cities, in Urayasu city and Kayanowan city, the proportion of the younger generation is high, especially in Kayanowan city, where the younger generation is 1.5 times higher than the national average, and it is a so-called “Young city”. In Yubari city, Atami city, Hagi city, the proportion of their aging population is higher than the national average and four out of ten people are senior citizens.
When you see the population rate, you know the fascination of central Tokyo.
 Reference: The data for the whole of Japan is according to population statistics in the Statistics Bureau. The data of Tokyo is according to the population census in the General Affairs bureau.
The data for Yubari city and Atami city are according to the population census in 2010. Other cities are according to their city council data and calculated by the author.
The reference date is on 1st March 2016 in Japan, 1st Jan 2016 in Tokyo, 31st March in Kayanowan city, 29th Feb 2016 in Hagi city, 1st Oct in Yubari city and Atami city and 1st Oct 2016 in other cities.